
Probably all Internet services give people a choice of either speed or data caps.
The DBIUA decided to see what would happen without imposing either of these on its members.
We got the fastest upstream connection that we could, and then we built our wireless network out and tried to provide the fastest speeds possible in an affordable manner.
In order to test the speeds on our internal network, we installed a speed test mini webpage on a server at the water tank. This allows people to test speeds to the tank.
If you are one or two hops from the tank, you can probably get upload and download speeds in the 40+mpbs range. If you are several hops away, then that tends to drop to the 20’s. And some places it’s around 10. But, that’s a far cry from the 1.5mbps that you sometimes got with DSL.
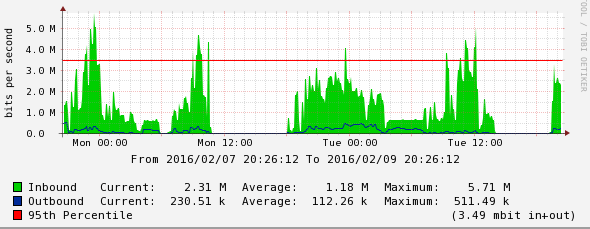
So, what does our overall bandwidth usage look like going out of the tank to the internet?
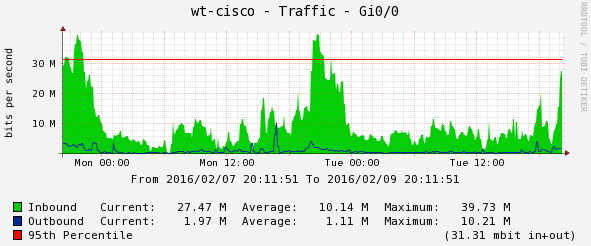
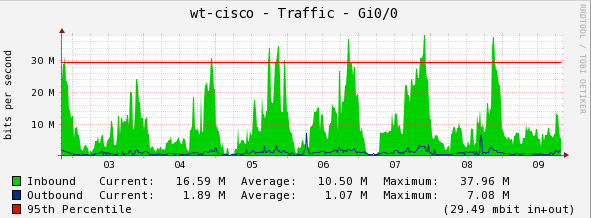
This is a snapshot of 2 days. Notice the spike in the evenings. So even though people may be able to download faster, the reality is they don’t consume that much, and it’s only generally in the evening. Here is another graph that shows this same traffic over a weeks time.
So, what about individual usage? Not all ISP’s graph this data, but we decided to do this so we could manage the network and identify any issues. I think those ISP’s that might do this, would probably not share this information, because it shows we actually use WAY less than we think we do.
Here is the usage graph for the connection from my house for that same 2 day period:
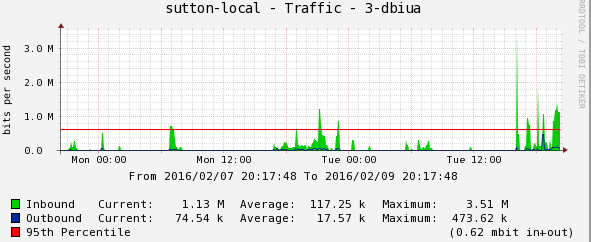
Notice the scale on the left. 3.0. Not 30.0 like the above graph. And the usage is way less. The larger blob at the far right is watching some video. The little spikes are various downloads. General web browsing, or youtube at lower rez is the other green blips.
Here is another person, with a different usage pattern:
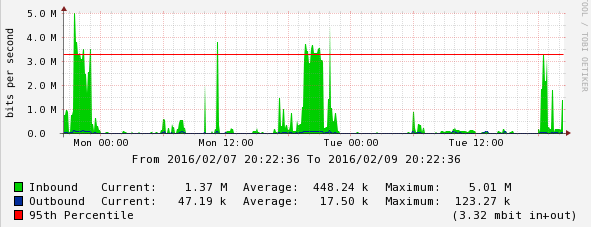
Notice the scale change again. This is someone streaming something high def (the large green blobs). But, there are still large swaths of time when nothing is happening.
Here are a few more

All of these individual usage patterns flow together to create the one at the top. We have not had to throttle anyone, or impose data caps. We allow everyone to use what is available at any given time on the network.
There have been times when a lot of people were streaming something around the same time, and guess what happened? Things slowed down a little bit for everyone. Sometimes there may have been a little buffering, but in general it has not been a problem.
The million dollar question is how much speed do you really need?
In my opinion, if you have a reliable 2-3mbps available to you, that is plenty. If you can burst to faster speeds as needed, that is an extra bonus. 6-8mbps means you can stream very high def video. But using 50 or 100mbps for long periods of time is actually not very common.
And, personally I have had times when slow speeds are not on our end, but instead on the other end of the connection, at the data center side, where a webserver might be throttled, or on a slow connection.
So, hopefully this gives you all some good real world information about our little socialist network experiment 🙂
